Simple and Effective Automated Code Review Software: SonarQube
Published at 2024-10-28

Do you lack seniors at your company to help with code reviews, or are you always getting LGTM? SonarQube is an open-source code quality inspection software that's easy to install and cross-platform. It offers a free community version as well as a paid enterprise version. Its core concept is clean code, and it checks whether your code meets three criteria: Security, Reliability, and Maintainability.
What Can SonarQube Do?
- Helps you catch bugs
- Identifies code smells
- Scans for security vulnerabilities
- Analyzes duplicate code
- Measures code coverage
- Assesses technical debt
- Integrates with tools like Jenkins, GitLab, GitHub, etc.
What Programming Languages Does It Support?
Here is a list of programming languages supported by SonarQube. In this analysis, we're working on a frontend Next.js project that uses TypeScript (& JavaScript), HTML, and CSS—all of which are within SonarQube's supported range.
Step 1: Local Installation
There are two ways to install SonarQube: you can achieve it by installing Java and a ZIP file, or you can install it directly using a Docker image. Since I don't have Java installed on my computer, I chose the simpler Docker installation method.
-
Go to Docker Hub and find sonarqube
1docker pull sonarqube -
Start the server:
1docker run -d --name sonarqube -e SONAR_ES_BOOTSTRAP_CHECKS_DISABLE=true -p 9000:9000 sonarqube:latestThen open your browser and navigate to http://localhost:9000 to see the login screen.
-
Enter the default username and password
admin. You'll be prompted to reset your password. After updating it, you can access the dashboard.
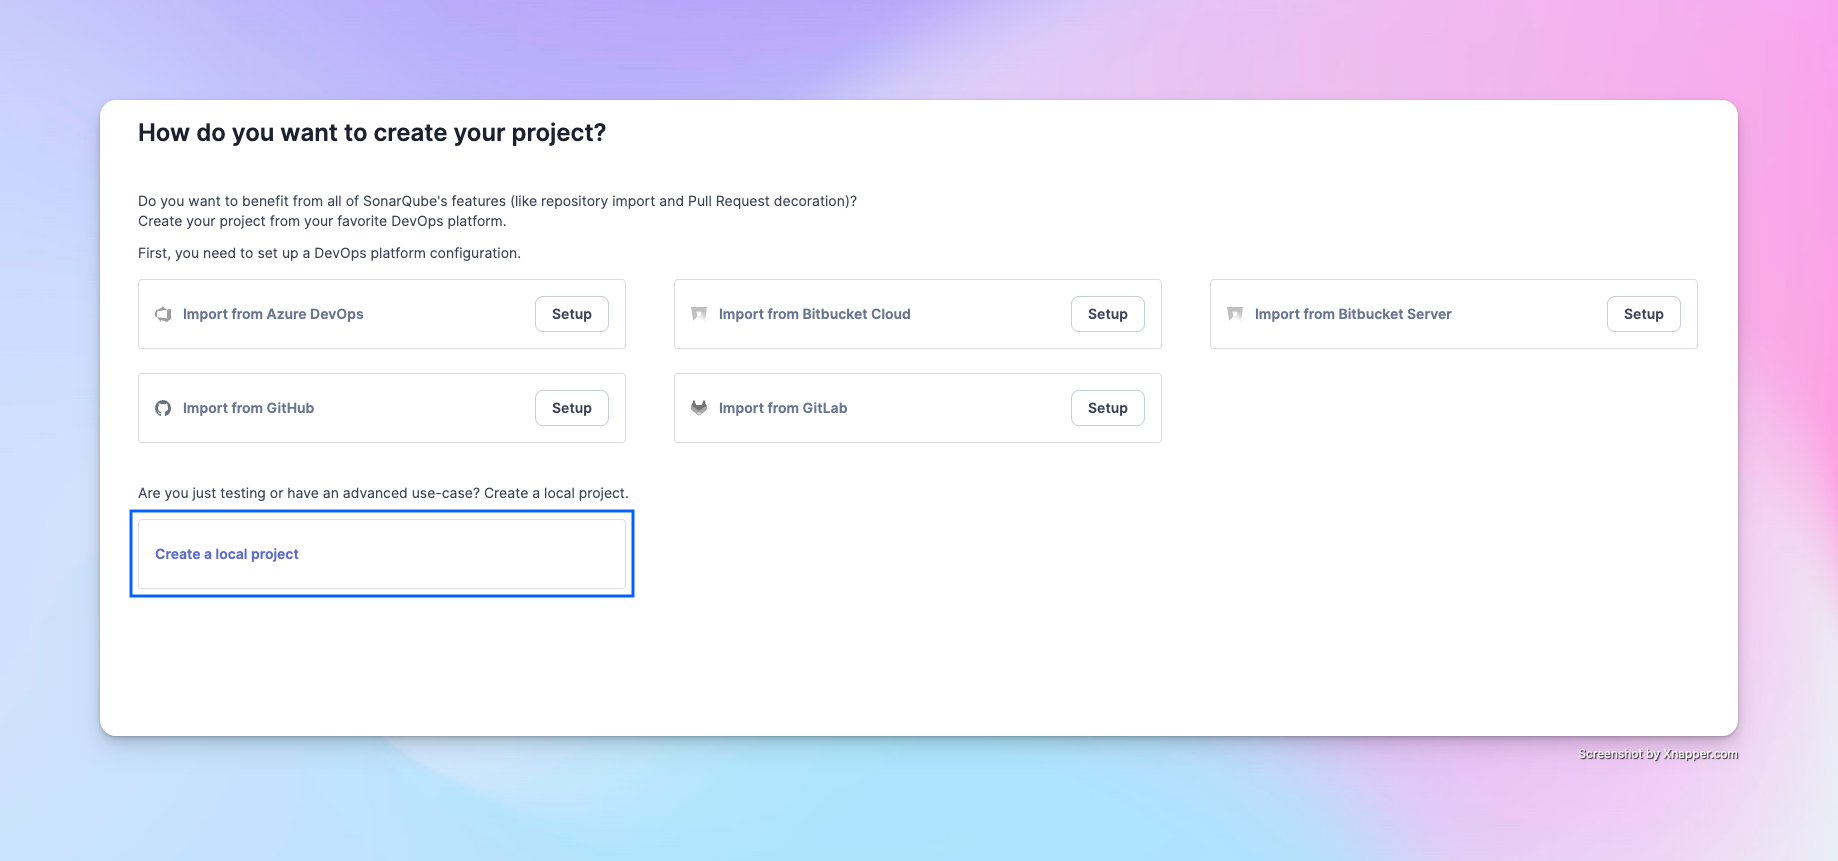
SonarQube can integrate with multiple platforms. For convenience in this demonstration, we'll use a local project.
Step 2: Create a Project
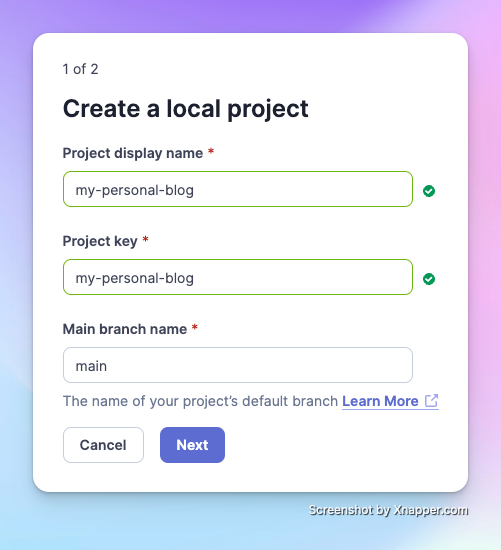
Enter the project name and the key name for the project token that you'll use later. By default, it's your project display name. After confirming the default branch for the project, click Next.
Step 3: Set the Criteria for "New Code"
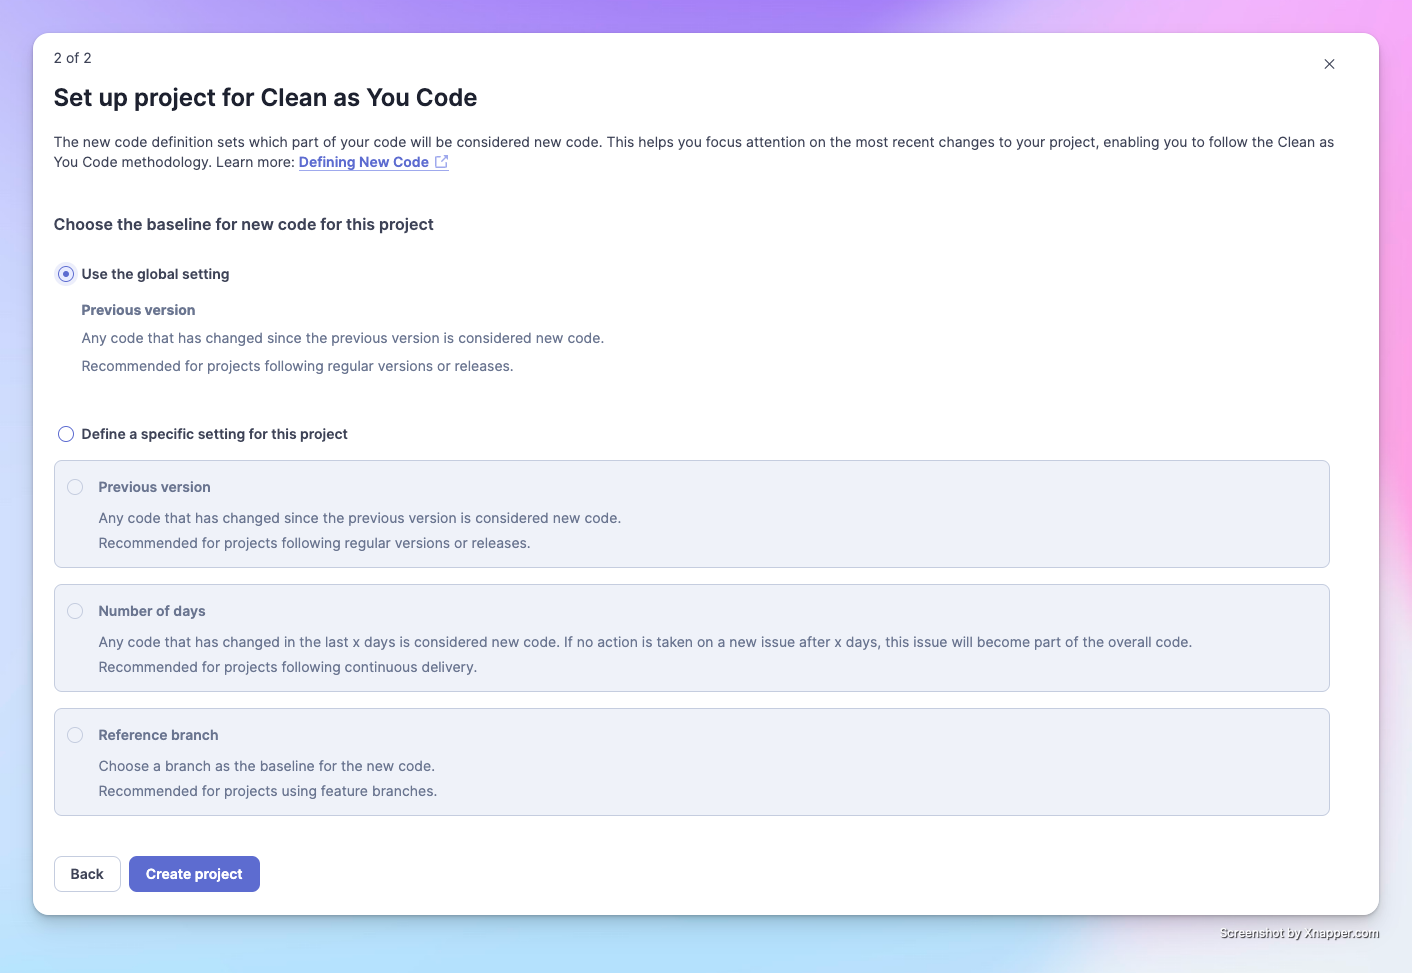
SonarQube focuses on analyzing "newly generated" code. This means that after you analyze once, the second time it will focus on the new changes you've made. Here you can set the criteria for SonarQube to judge "new code." Since there's no specific requirement at the moment, we'll choose the default option.
After creation, you'll reach this screen:
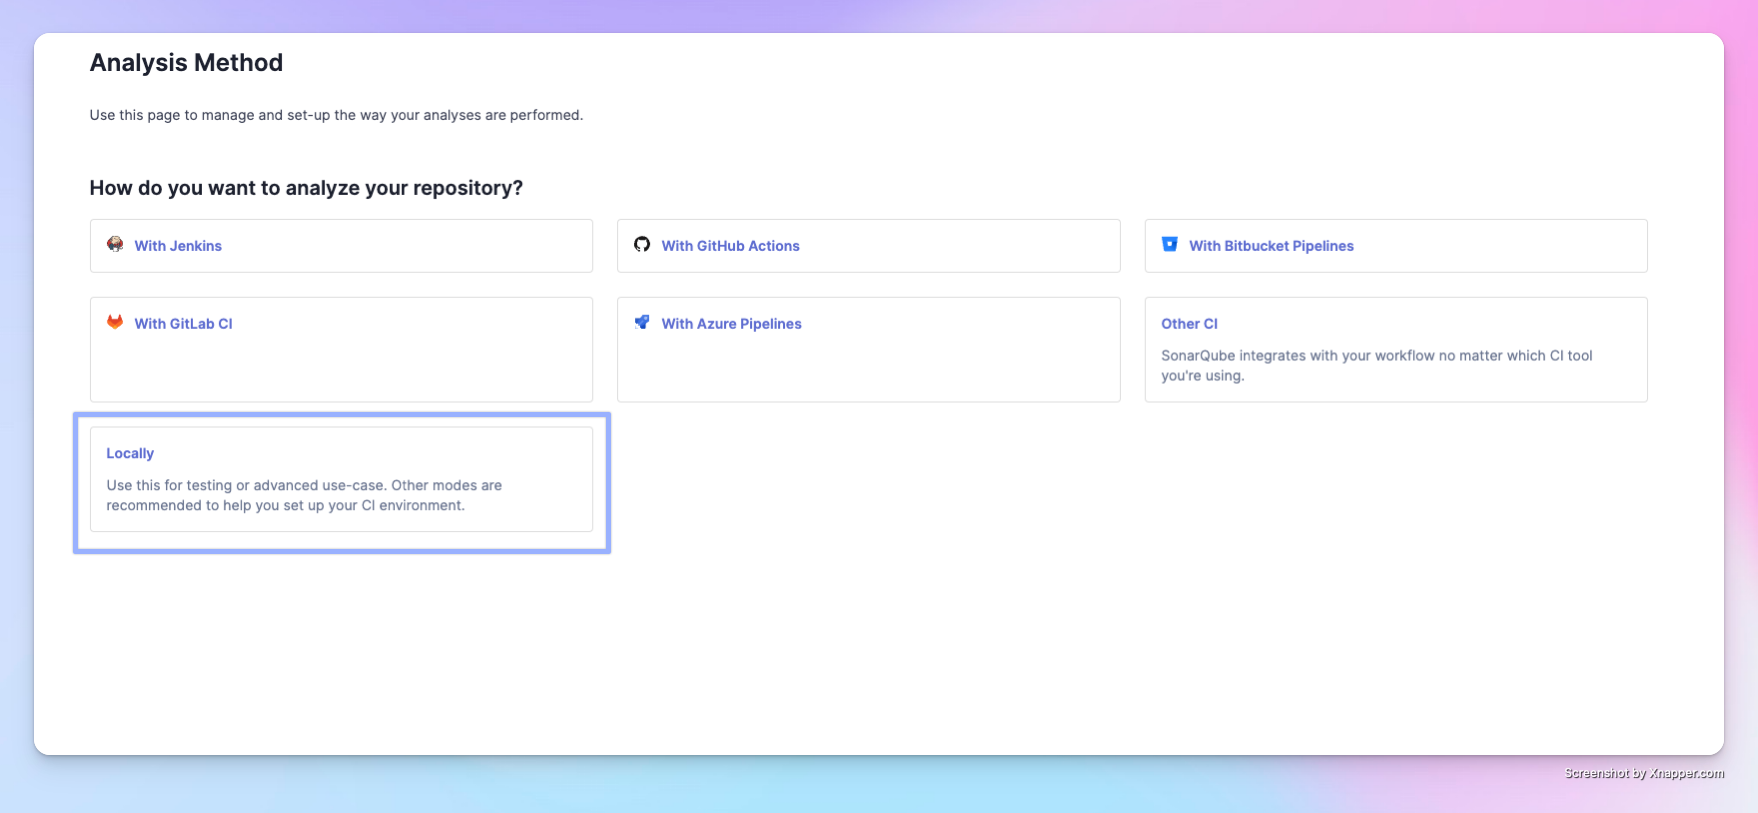
There are many options to integrate with CI platforms. For the purpose of this introduction, we'll use Locally to perform code analysis on our machine.
Step 4: Generate a Token for the Project
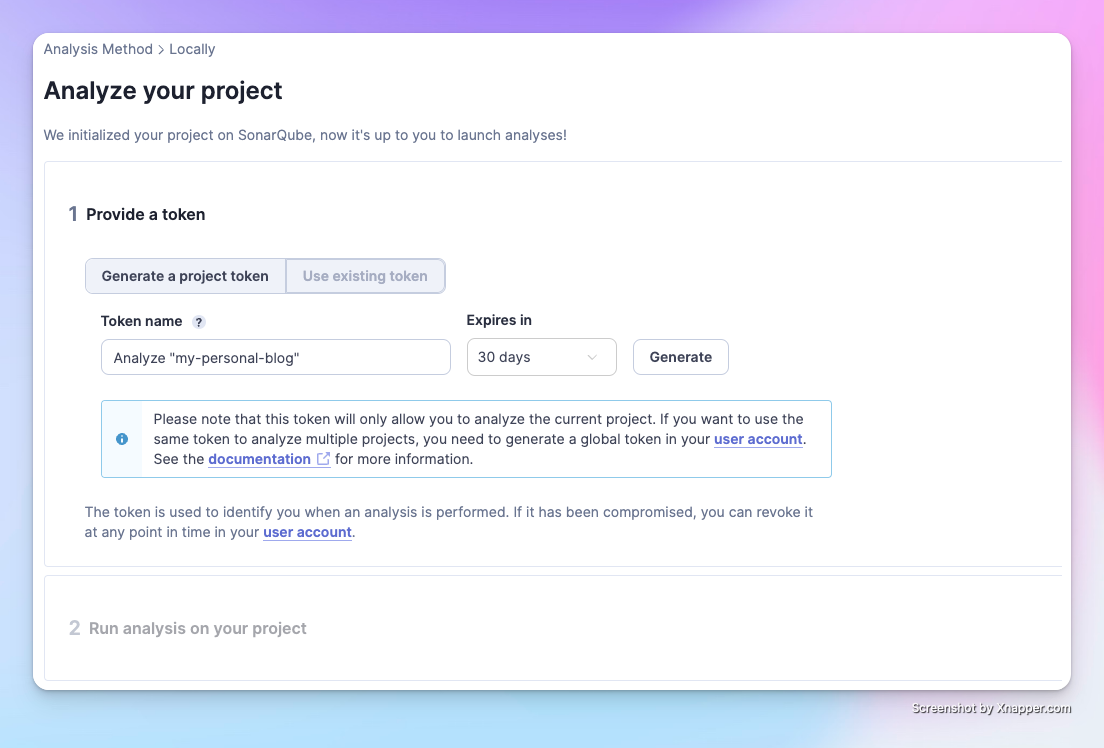
Click Generate to create a dedicated token for your project. This token must be kept securely in a private place.
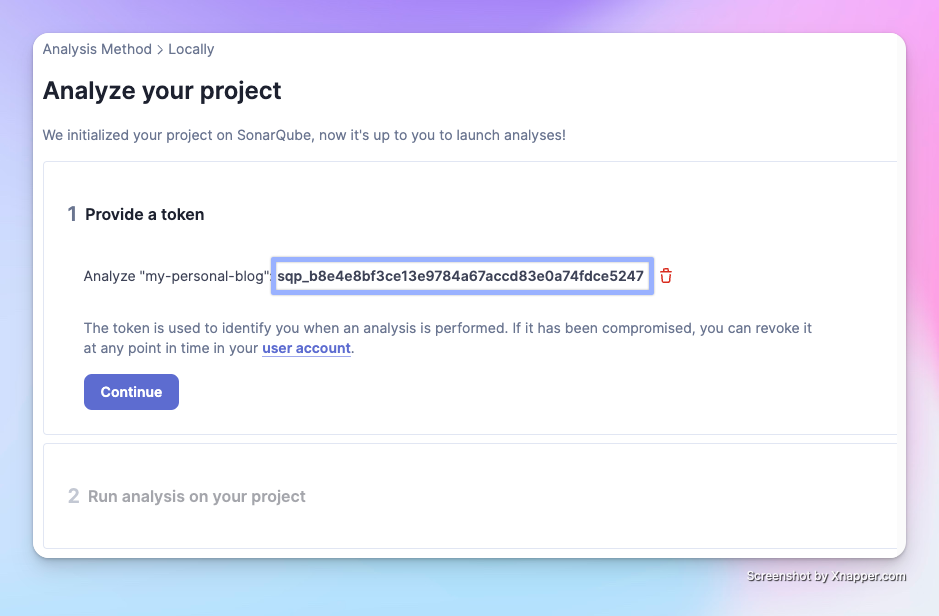
Click Continue, and SonarQube will prompt you to install the appropriate Scanner for your operating system.
Step 5: Install the Scanner
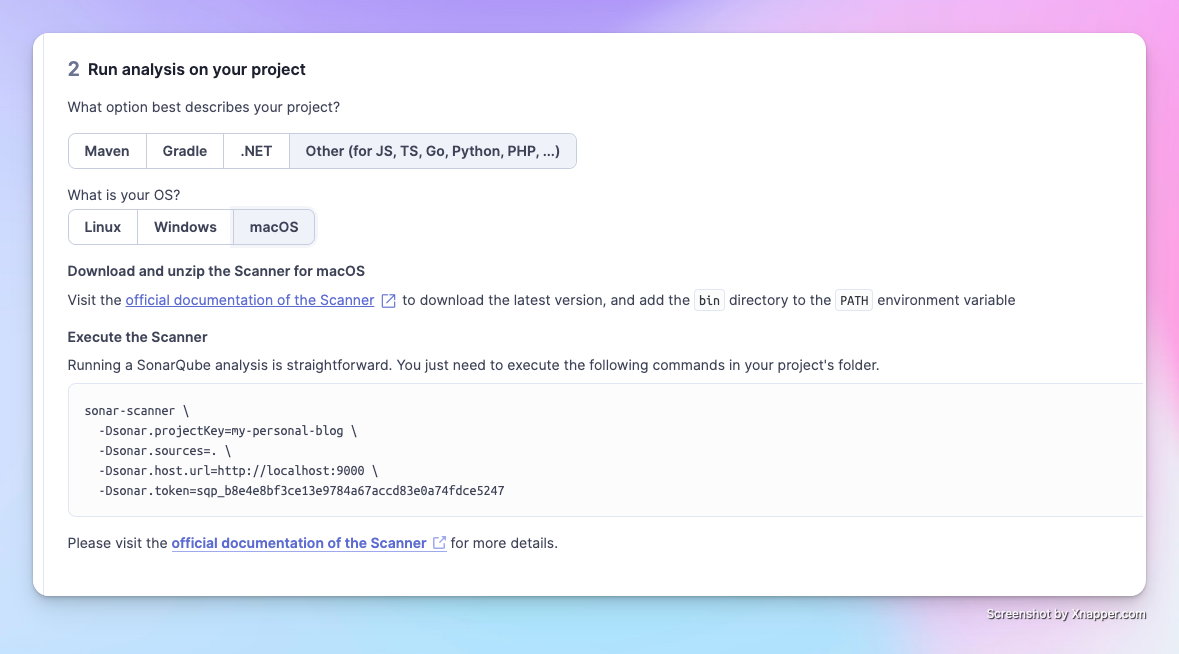
You can click on the official documentation for the Scanner for installation methods.
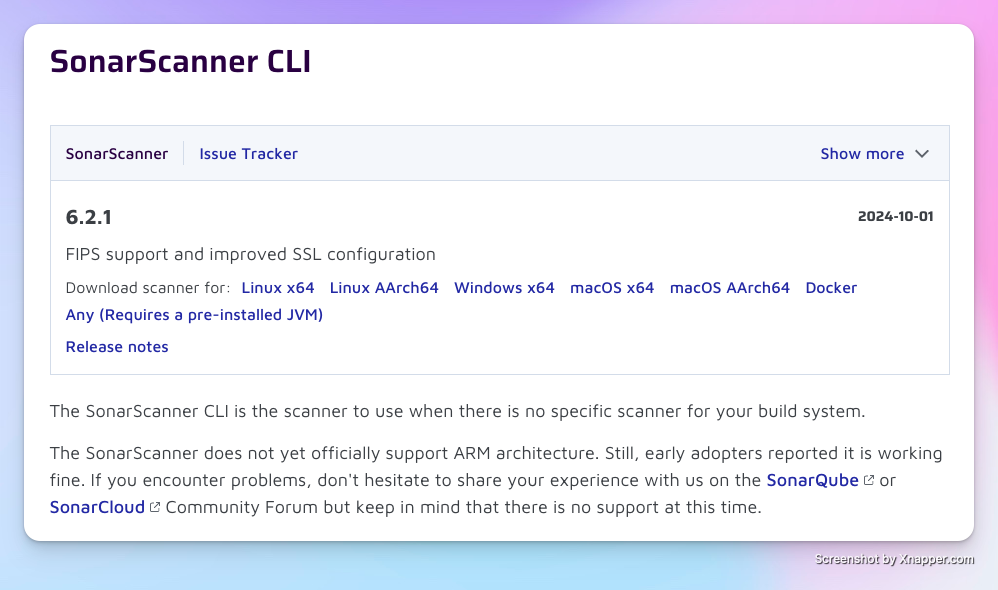
I'm currently using macOS M2. If you're unsure whether to install macOS x64 or macOS AArch64 on your Mac, you can type uname -a in the terminal.
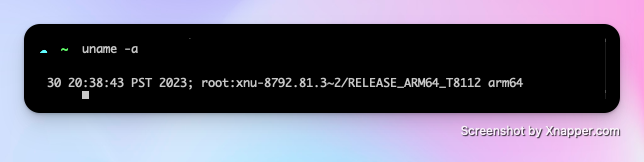
If it shows arm64, please install macOS AArch64; if it shows x64, install macOS x64. Although the official documentation states that ARM architecture is not yet officially supported, users have reported normal operation. I haven't encountered any issues during installation and use so far. After downloading, just unzip it.
Step 6: Project Configuration File
In the root directory of the project you want to analyze, add a file named sonar-project.properties.
The official documentation provides an example:
1# must be unique in a given SonarQube instance
2sonar.projectKey=my-personal-blog
3
4# --- optional properties ---
5
6# defaults to project key
7#sonar.projectName=My project
8# defaults to 'not provided'
9#sonar.projectVersion=1.0
10
11# Path is relative to the sonar-project.properties file. Defaults to .
12#sonar.sources=.
13
14# Encoding of the source code. Default is default system encoding
15#sonar.sourceEncoding=UTF-8
If you want to make some other settings, you can uncomment the lines below.
- sonar.projectName: Defines the name of the project. If not set, it will use
sonar.projectKeydirectly. - sonar.projectVersion: Defines the version of the project. You can set this property to
1.0, so when the project analysis results are submitted to SonarQube, it will display version information, which is helpful for version tracking. - sonar.sources: Sets the current path of the code. If there's no special requirement, keeping
.is fine. - sonar.sourceEncoding: Encoding format, default is UTF-8.
Step 7: Install SonarScanner CLI
-
Open the Scanner folder you just unzipped, find the
/conffolder, and open thesonar-scanner.propertiesfile inside. -
Uncomment
sonar.host.urland change the default value tohttp://localhost:9000. After the change, it should look like this:1#----- SonarQube server URL (default to SonarCloud) 2sonar.host.url=http://localhost:9000 -
Add
<your Scanner installation path>/binto the global environment variable. Here I'm using zsh and vim. In the terminal, entervim ~/.zshrc(if using Bash, entervim ~/.bashrc). Then open the editor and paste:1export PATH=$PATH:<your Scanner installation path>/binIf you want to know your Scanner installation path, navigate to the installation folder in the terminal and enter
pwdto get the path. Replace<your Scanner installation path>, and it will look like this:1# This is for Scanner CLI 2export PATH=$PATH:/Downloads/your-downloaded-folder/binAfter saving and exiting the editor, to test if the installation was successful, enter
sonar-scanner -hin the terminal. You should see the following output:1usage: sonar-scanner [options] 2 3Options: 4-D,--define <arg> Define property 5-h,--help Display help information 6-v,--version Display version information 7-X,--debug Produce execution debug outputAlternatively, enter
sonar-scanner -vto check version information. If there's no error, the CLI has been successfully installed!
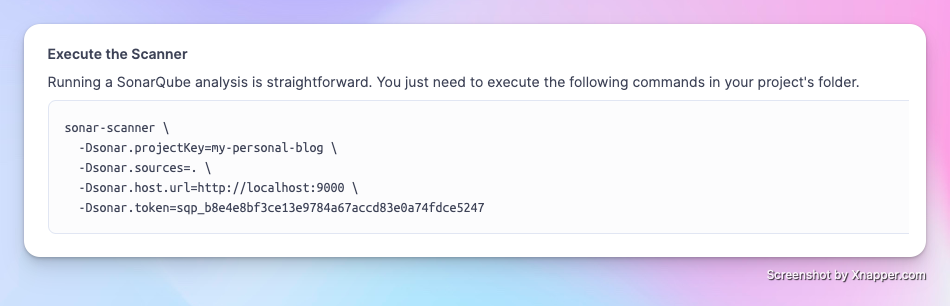
Step 8: Run the Scan
Next, paste the following command into the terminal to start the code analysis.
After running the code, the page will update to show your analysis results:
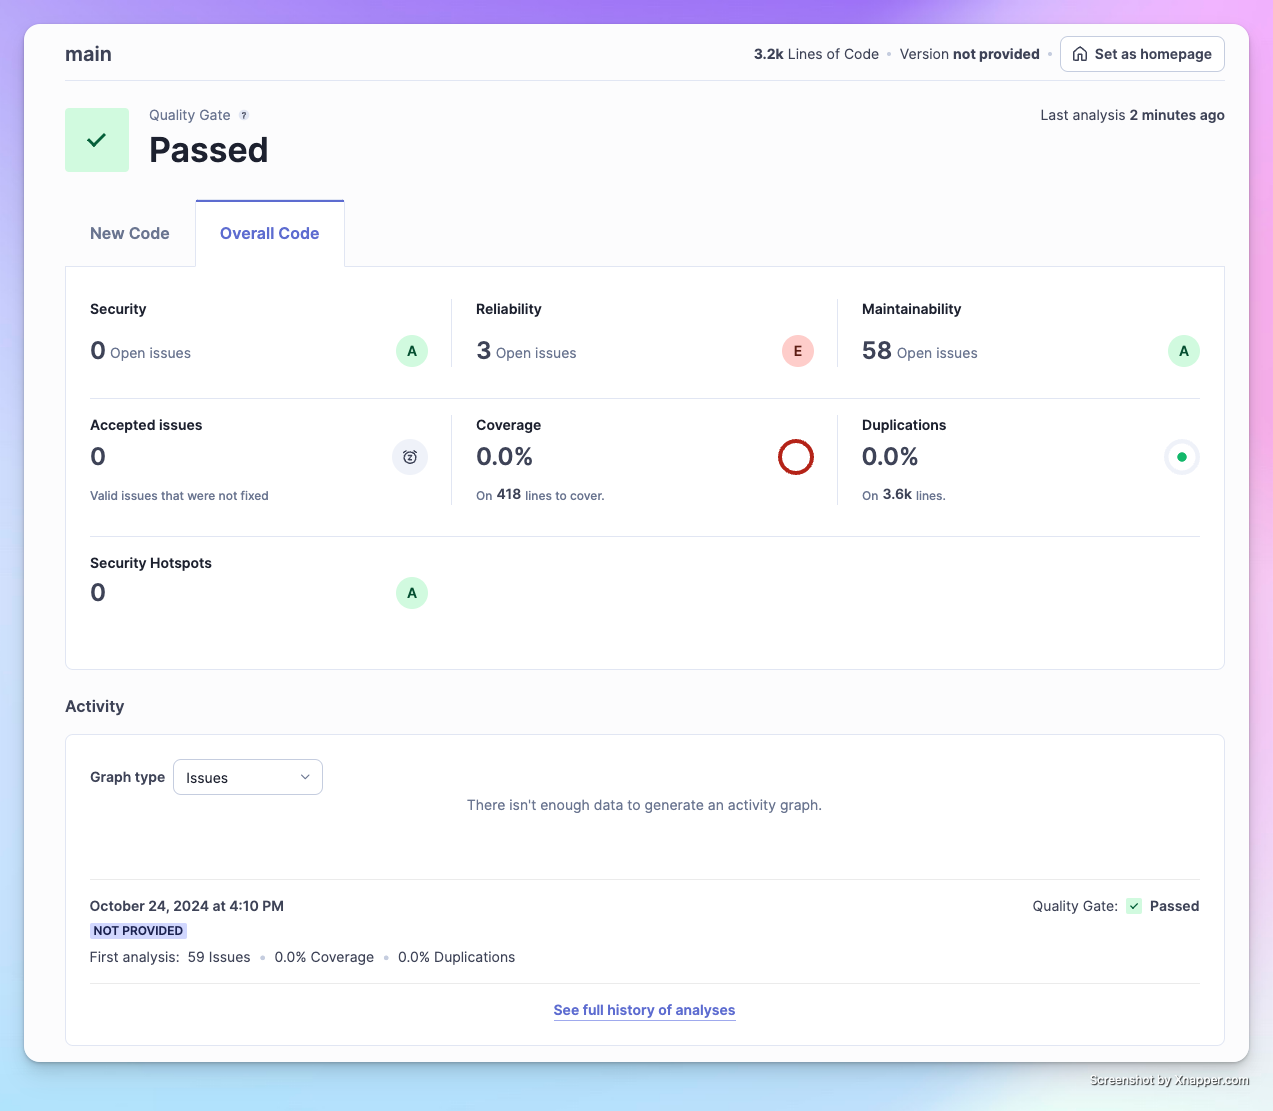
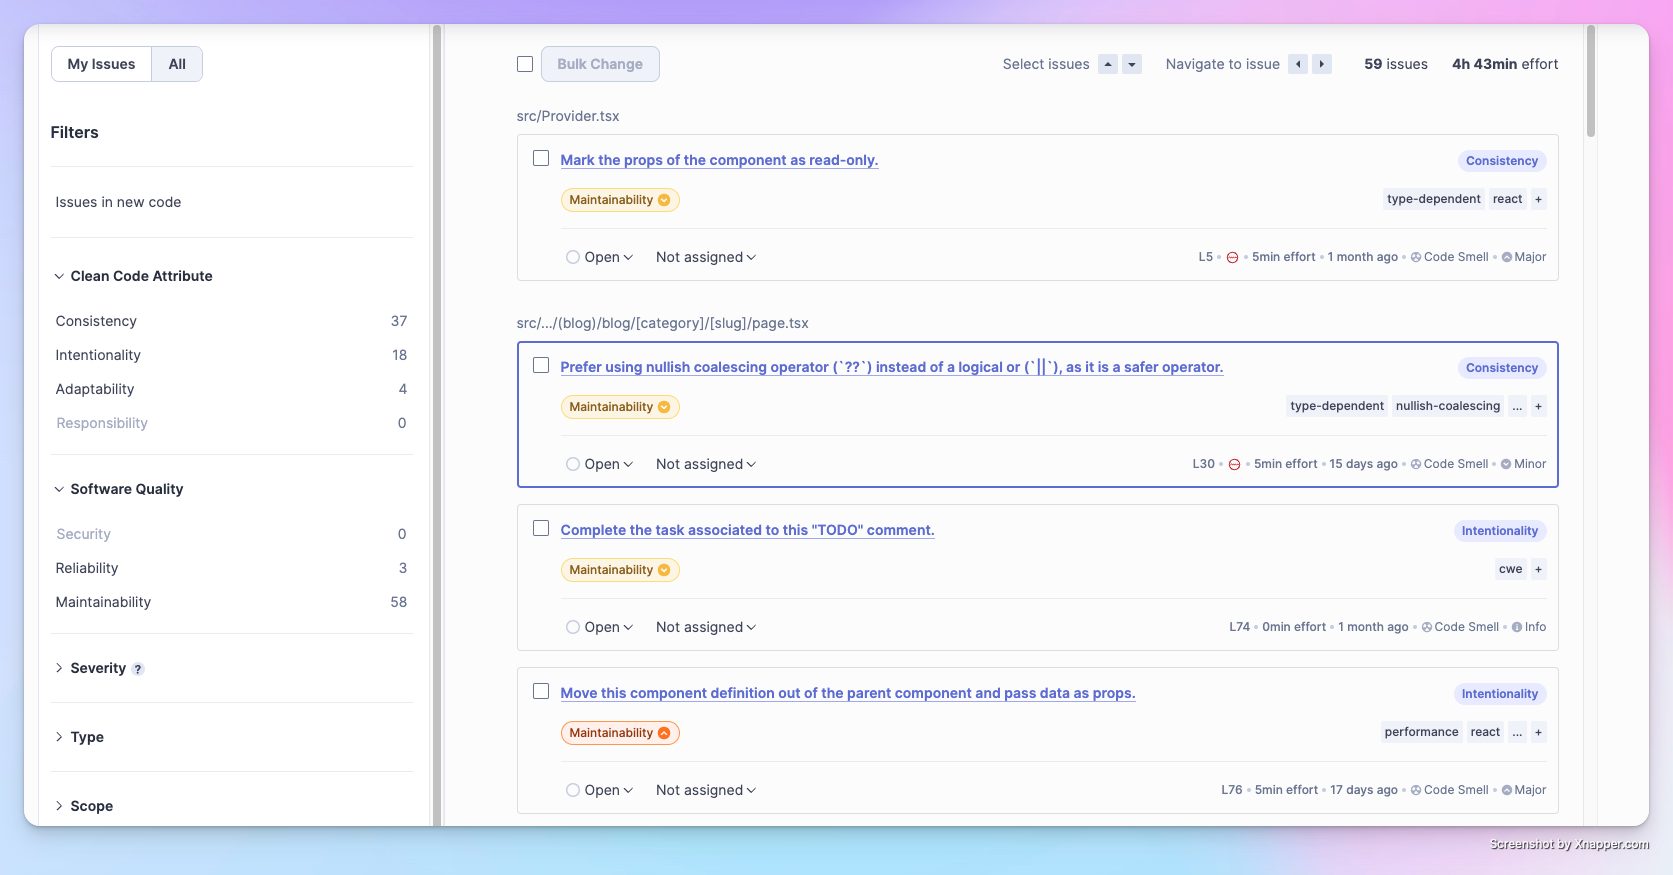
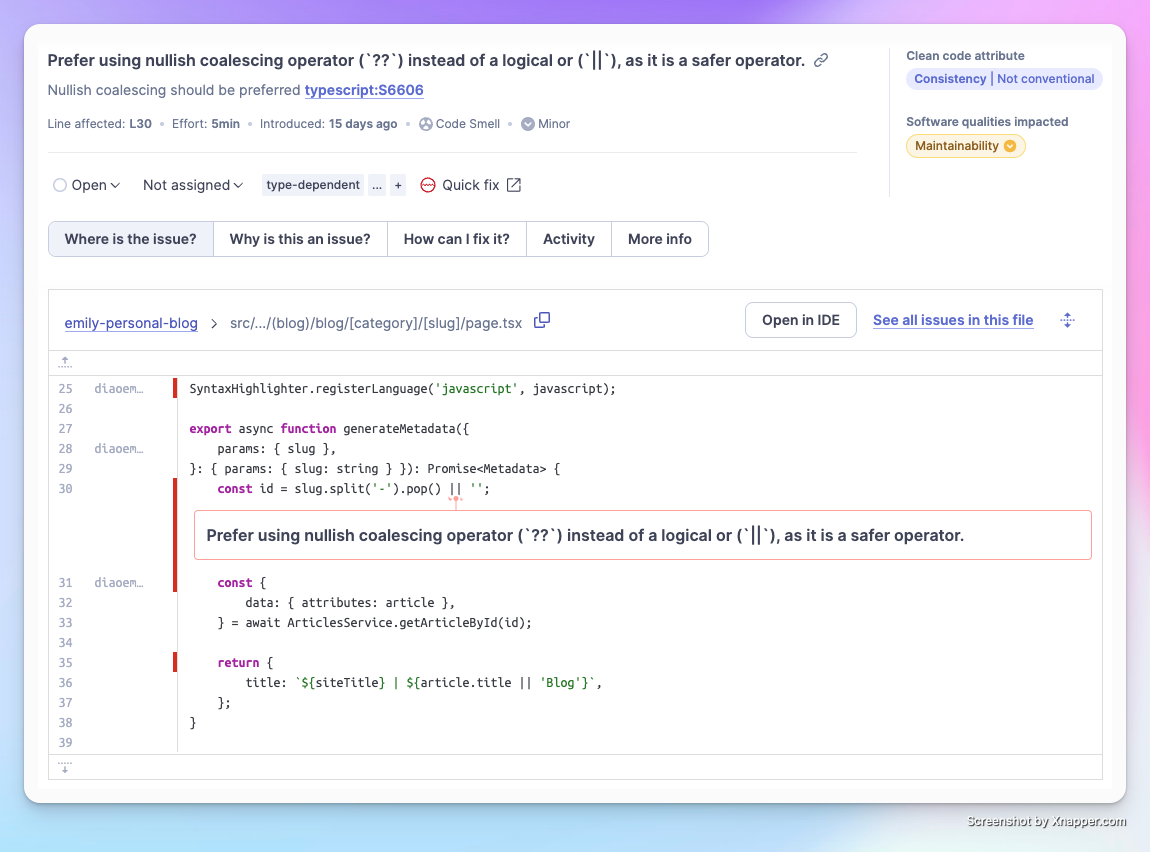
Click on the Issues tab to view the problems in more detail.
Technical Debt Chart
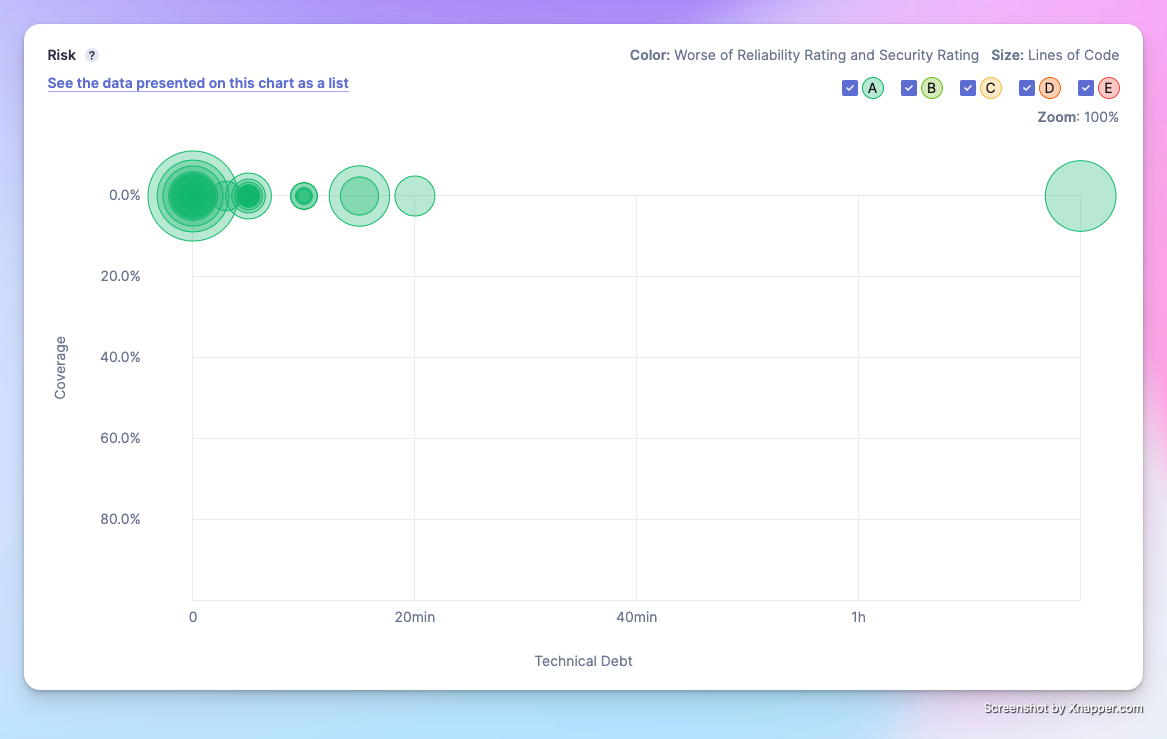
The technical debt chart shows whether your project's code has technical debts that require a significant amount of time to address. The analysis consists of Code Coverage, Lines of Code, Reliability Rating, and Security Rating.
- X-axis: Represents the time required to address this technical debt—the further to the right, the greater the workload. In the figure above, one file has a technical debt workload exceeding 1 hour and 20 minutes, which needs attention.
- Y-axis: Represents the test coverage of the code—the higher up, the lower the coverage. This project hasn't started writing unit tests yet, so the coverage is 0.
- Circle Size: The larger the circle, the more lines of code it contains.
- Color: Represents levels of reliability and security, graded from A to E from good to bad. The darker the color, the more severe the code issues.
Conclusion
With this code inspection tool, you can run analyses at any time to prevent yourself from accumulating technical debt during development. Start by running it locally, and hopefully, in the future, it can be integrated into the company's GitLab CI.